As a Microsoft Evangelist at Nutanix, I am always asked….”How would you monitor your Nutanix Infrastructure and can I use System Center suite. And my answer always is, “YES, with SCOM”….What is SCOM you ask?

 System Center Operations Manager (SCOM) is designed to be a monitoring tool for the datacenter. Think of a datacenter with multiple vendors representing multiple software and hardware products. Consequently, SCOM was developed to be extensible using the concept of management packs. Vendors typically develop one or more management packs for every product they want plugged into SCOM.
To facilitate these management packs, SCOM supports standard discovery and data collection mechanisms like SNMP, but also affords vendors the flexibility of native API driven data collection. Nutanix provides management packs that support using the Microsoft System Center Operations Manager (SCOM) to monitor a Nutanix cluster.
Nutanix SCOM Management Pack
The management packs collect information about software (cluster) elements through SNMP and hardware elements through ipmiutil (Intelligent Platform Management Interface Utility) and REST API calls and then package that information for SCOM to digest. Note: The Hardware Elements Management Pack leverages the ipmiutil program to gather information from Nutanix block for Fans, Power Supply and Temperature.

Nutanix provides two management packs:
- Cluster Management Pack – This management pack collects information about software elements of a cluster including Controller VMs, storage pools, and containers.
- Hardware Management Pack – This management pack collects information about hardware elements of a cluster including fans, power supplies, disks, and nodes.
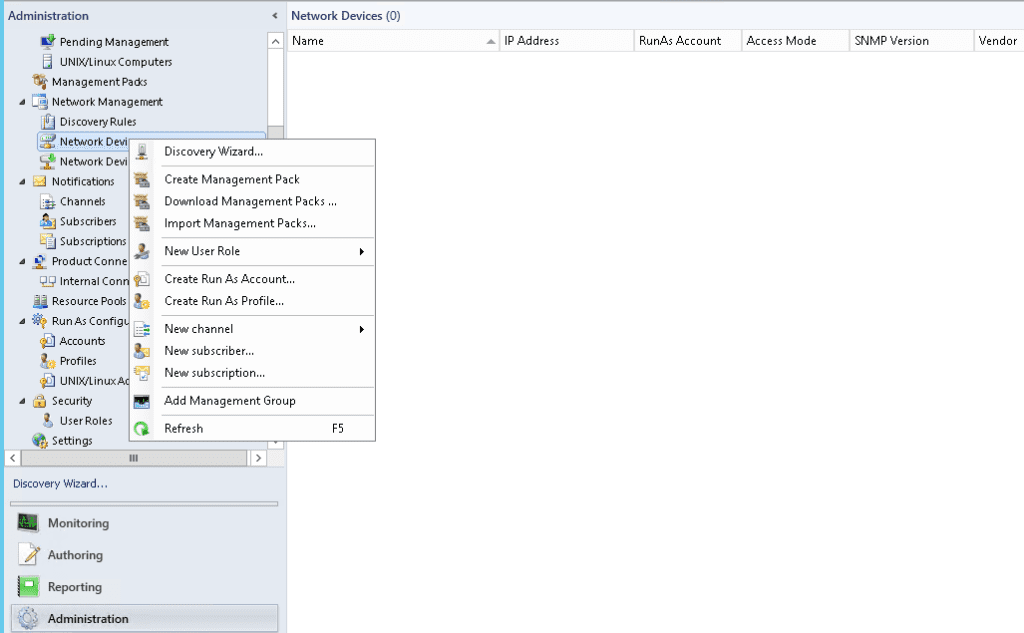
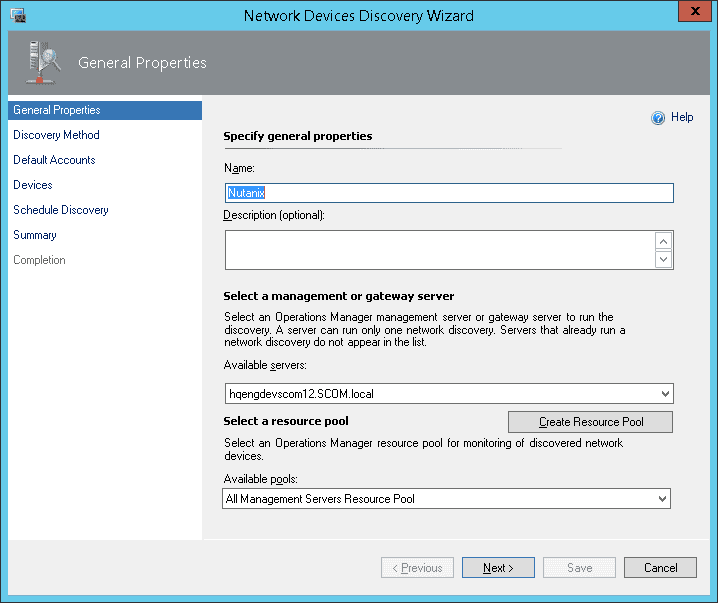
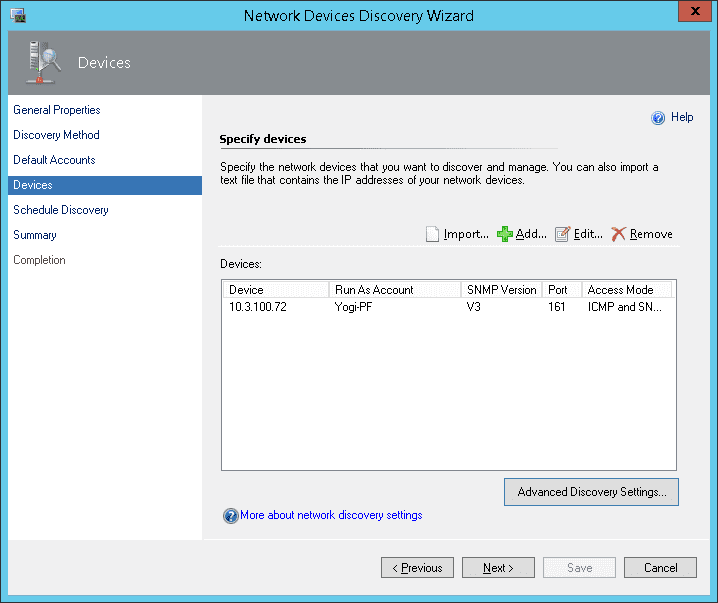
Installing and configuring the management packs involves the following simple steps:
- Install and configure SCOM on the Windows server system (if not installed) (will blog a post soon on this topic)
- Uninstall existing Nutanix management packs (if present)
- Open the IPMI-related ports (if not open). IPMI access is required for the hardware management pack
- Install the Nutanix management packs
- Configure the management packs using the SCOM discovery and template wizards


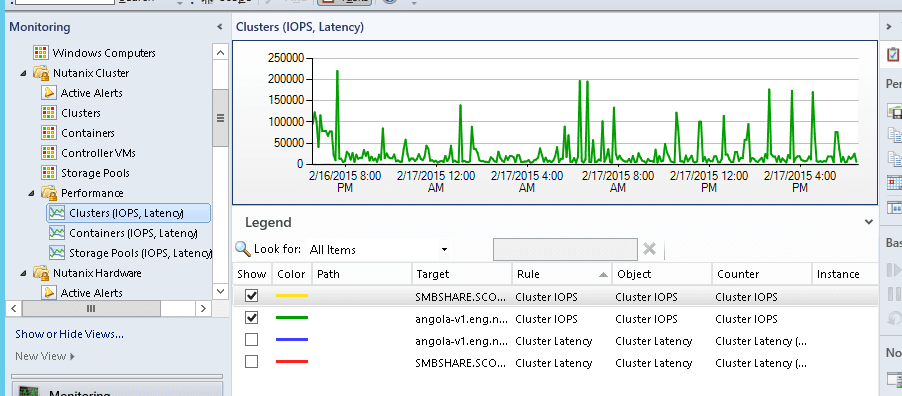
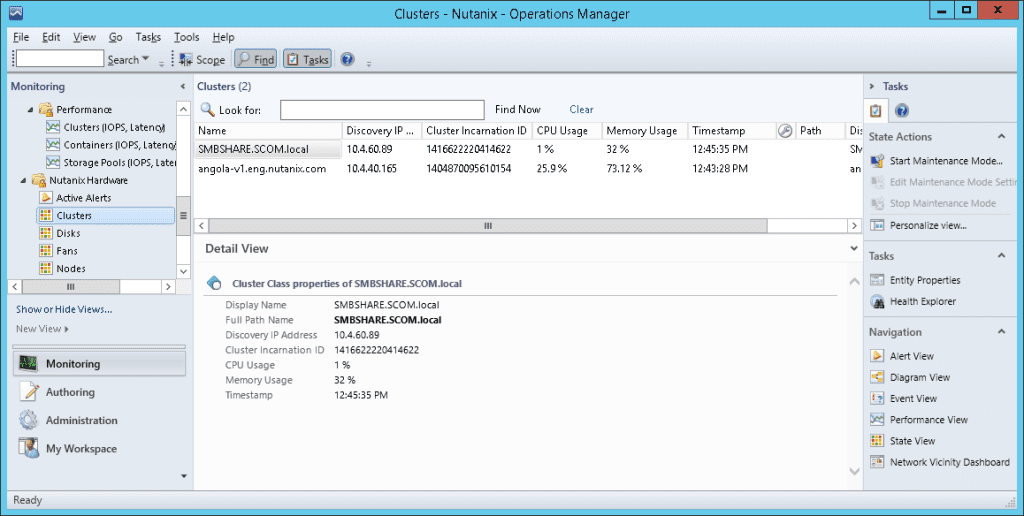
 After the management packs have been installed and configured, you can use SCOM to monitor a variety of Nutanix objects including cluster, alert, and performance views as shown in examples below. Also, I check out this great video produced by pal @mcghem . He shows a great demo of the SCOM management pack…Kudo’s Mike….also, check out his blog.
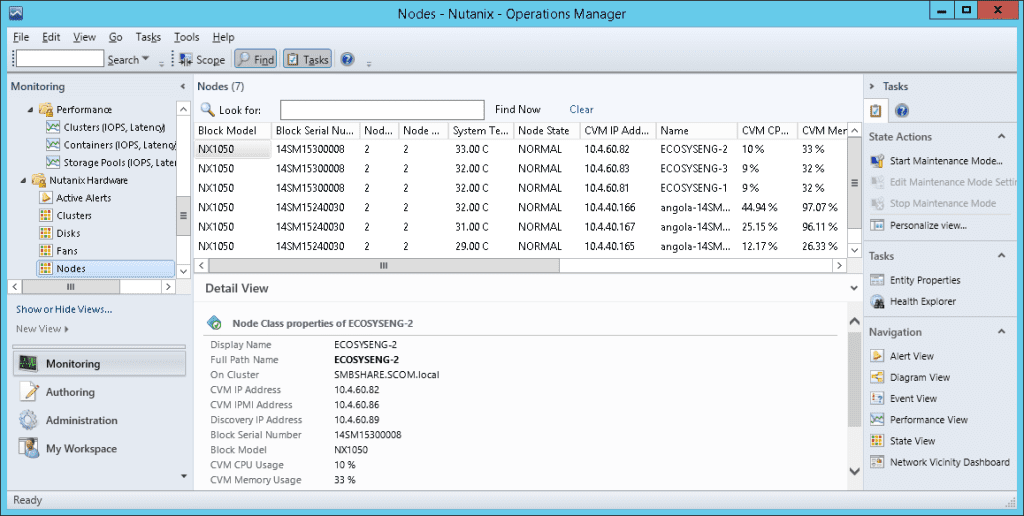
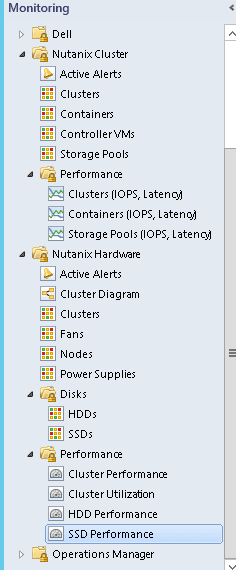
Views and Objects Snapshots 
Cluster Monitoring Snapshots

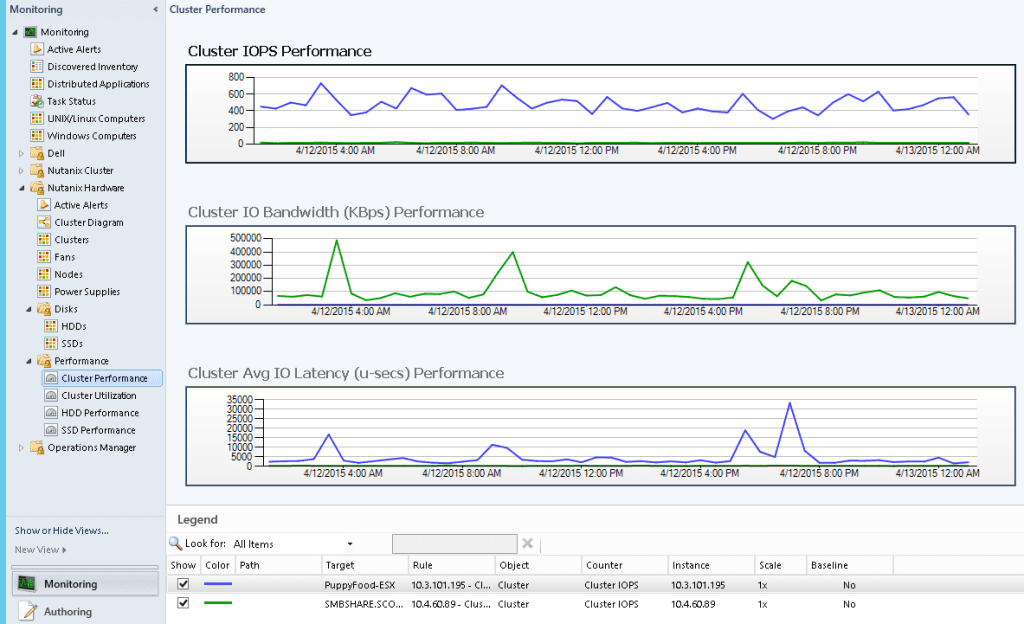
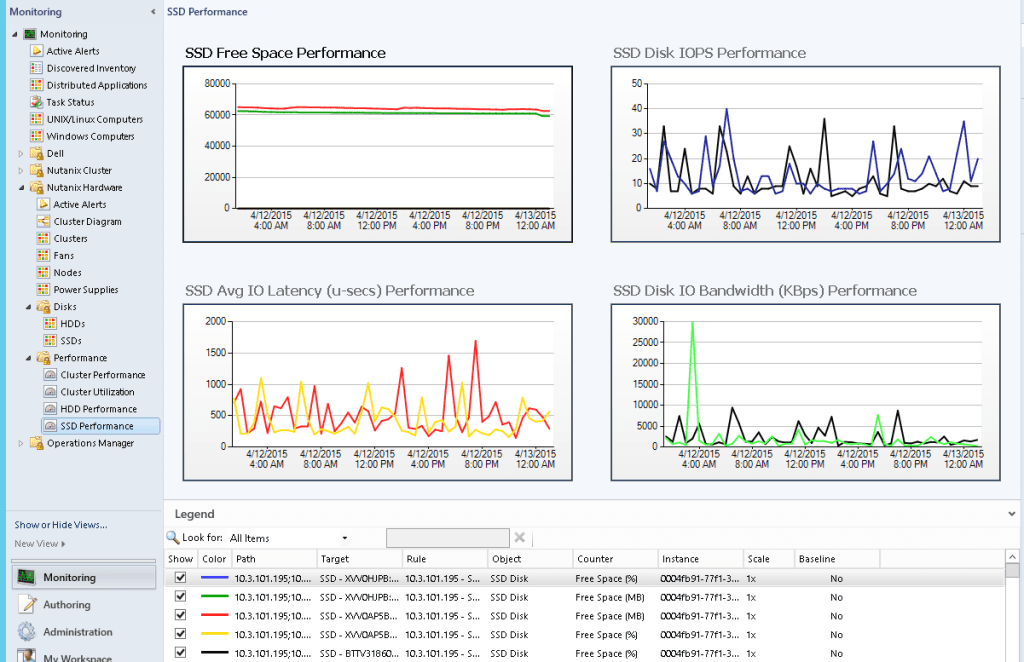
Cluster Performance Monitoring


Hardware Monitoring Snapshots 

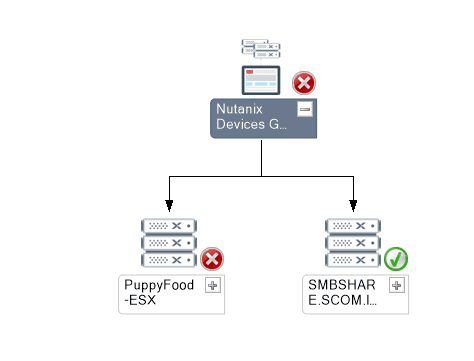
In the following diagram views, users can navigate to the components with failure.

Nutanix Objects Available for Monitoring via SCOM
The following provides an high level overview of Nutanix Cluster with Components:

The following sections describe Nutanix Cluster objects being monitored by this version of MPs:
Cluster
Monitored Element | Description |
Version | Current cluster version. This is the nutanix-core package version expected on all the Controller VMs. |
Status | Current Status of the cluster. This will usually be one of started or stopped |
TotalStorageCapacity | Total storage capacity of the cluster |
UsedStorageCapacity | Number of bytes of storage used on the cluster |
Iops | For Performance: Cluster wide average IO operations per second |
Latency | For Performance: Cluster wide average latency |
CVM Resource Monitoring
Monitored Element | Description |
ControllerVMId | Nutanix Controller VM Id |
Memory | Total memory assigned to CVM |
NumCpus | Total number of CPUs allocated to a CVM |
Storage
Storage Pool
A storage pool is a group of physical disks from SSD and/or HDD tier.
Monitored Element | Description |
PoolId | Storage pool id |
PoolName | Name of the storage pool |
TotalCapacity | Total capacity of the storage pool Note: An alert if there is drop in capacity may indicate a bad disk. |
UsedCapacity | Number of bytes used in the storage pool |
Performance parameters:
Monitored Element | Description |
IOPerSecond | Number of IO operations served per second from this storage pool. |
AvgLatencyUsecs | Average IO latency for this storage pool in microseconds |
Containers
A container is a subset of available storage within a storage pool. Containers hold the virtual disks (vDisks) used by virtual machines. Selecting a storage pool for a new container defines the physical disks where the vDisks will be stored.
Monitored Element | Description |
ContainerId | Container id |
ContainerName | Name of the container |
TotalCapacity | Total capacity of the container |
UsedCapacity | Number of bytes used in the container |
Performance parameters:
Monitored Element | Description |
IOPerSecond | Number of IO operations served per second from this container. |
AvgLatencyUsecs | Average IO latency for this container in microseconds |
Hardware Objects
Cluster
Monitored Element | Description |
Discovery IP Address | IP address used for discovery of cluster |
Cluster Incarnation ID | Unique ID of cluster |
CPU Usage | CPU usage for all the nodes of cluster |
Memory Usage | Memory usage for all the nodes of cluster |
Node IP address | External IP address of Node |
System Temperature | System Temperature |
Disk
Monitored Element | Description |
Disk State/health | Node state as returned by the PRISM [REST /hosts “state” attribute ] |
Disk ID | ID assigned to the disk |
Disk Name | Name of the disk (Full path where meta data stored) |
Disk Serial Number | Serial number of disk |
Hypervisor IP | Host OS IP where disk is installed |
Tire Name | Disk Tire |
CVM IP | Cluster VM IP which controls the disk |
Total Capacity | Total Disk capacity |
Used Capacity | Total Disk used |
Online | If Disk is online or offline |
Location | Disk location |
Cluster Name | Disk cluster name |
Discovery IP address | IP address through which Disk was discovered |
Disk Status | Status of the disk |
Node
Monitored Element | Description |
Node State/health | Node state as returned by the PRISM [REST /hosts “state” attribute ] |
Node IP address | External IP address of Node |
IPMI Address | IPMI IP address of Node |
Block Model | Hardware model of block |
Block Serial Number | Serial number of block |
CPU Usage % | CPU usage for Node |
Memory Usage % | Memory usage for node |
Fan Count | Total fans |
Power Supply Count | Total Power supply |
System Temperature | System Temperature |
Fan
Monitored Element | Description |
Fan number | Fan number |
Fan speed | Fan speed in RPM |
Power supply
Element | Description |
| |
Power supply number | Power supply number |
Power supply status | Power supply status whether present or absent |
If you would like to checkout the Nutanix management pack on your SCOM instance, please go to our portal to download the management pack and documentation.
This management pack was development by our awesome engineering team @ Nutanix. Kudos to Yogi and team for a job well done!!! 😉 I hope I gave you a good feel for Nutanix monitoring using SCOM. As always, if you have any questions or comments, please leave below….
Until next time….Rob


 System Center Operations Manager (SCOM) is designed to be a monitoring tool for the datacenter. Think of a datacenter with multiple vendors representing multiple software and hardware products. Consequently, SCOM was developed to be extensible using the concept of management packs. Vendors typically develop one or more management packs for every product they want plugged into SCOM.
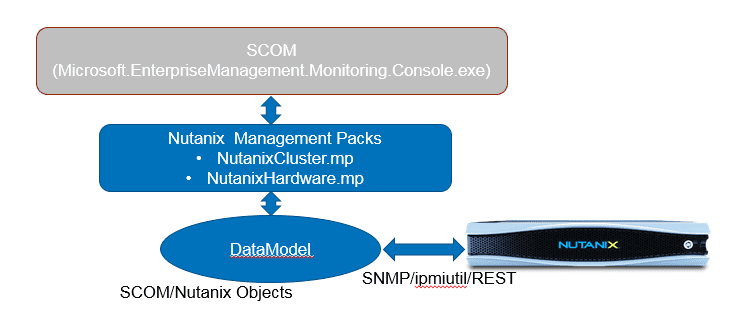


 After the management packs have been installed and configured, you can use SCOM to monitor a variety of Nutanix objects including cluster, alert, and performance views as shown in examples below. Also, I check out this great video produced by pal @mcghem . He shows a great demo of the SCOM management pack…Kudo’s Mike….also, check out his blog.


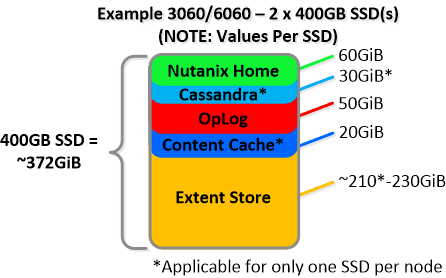
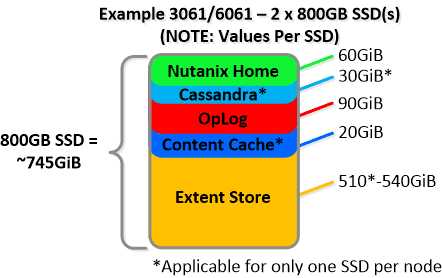
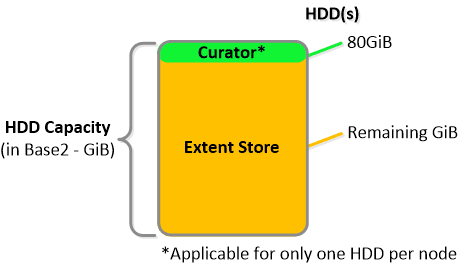
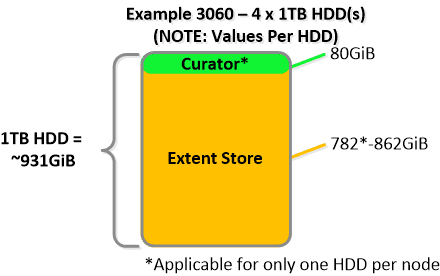

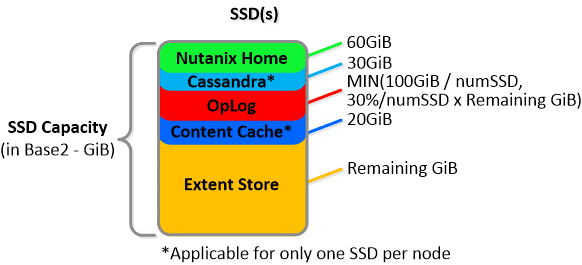 NOTE: The sizing for OpLog is done dynamically as of release 4.0.1 which will allow the extent store portion to grow dynamically. The values used are assuming a completely utilized OpLog. Graphics and proportions aren’t drawn to scale. When evaluating the Remaining GiB capacities do so from the top down.


 For a 6060 node which has 4 x 4TB HDDs this would give us 80GiB reserved for Curator and ~14TiB of Extent Store HDD capacity per node.
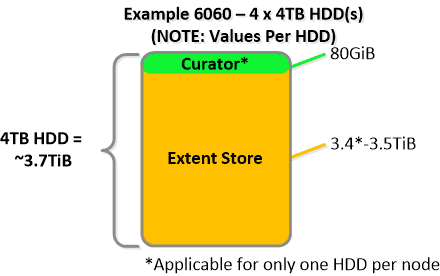 Statistics and technical specifications: